Temporal Validation Deep Dive#
A temporal validation deep dive is currently available in the Dirty Duck tutorial. Dirty Duck - Temporal Cross-validation
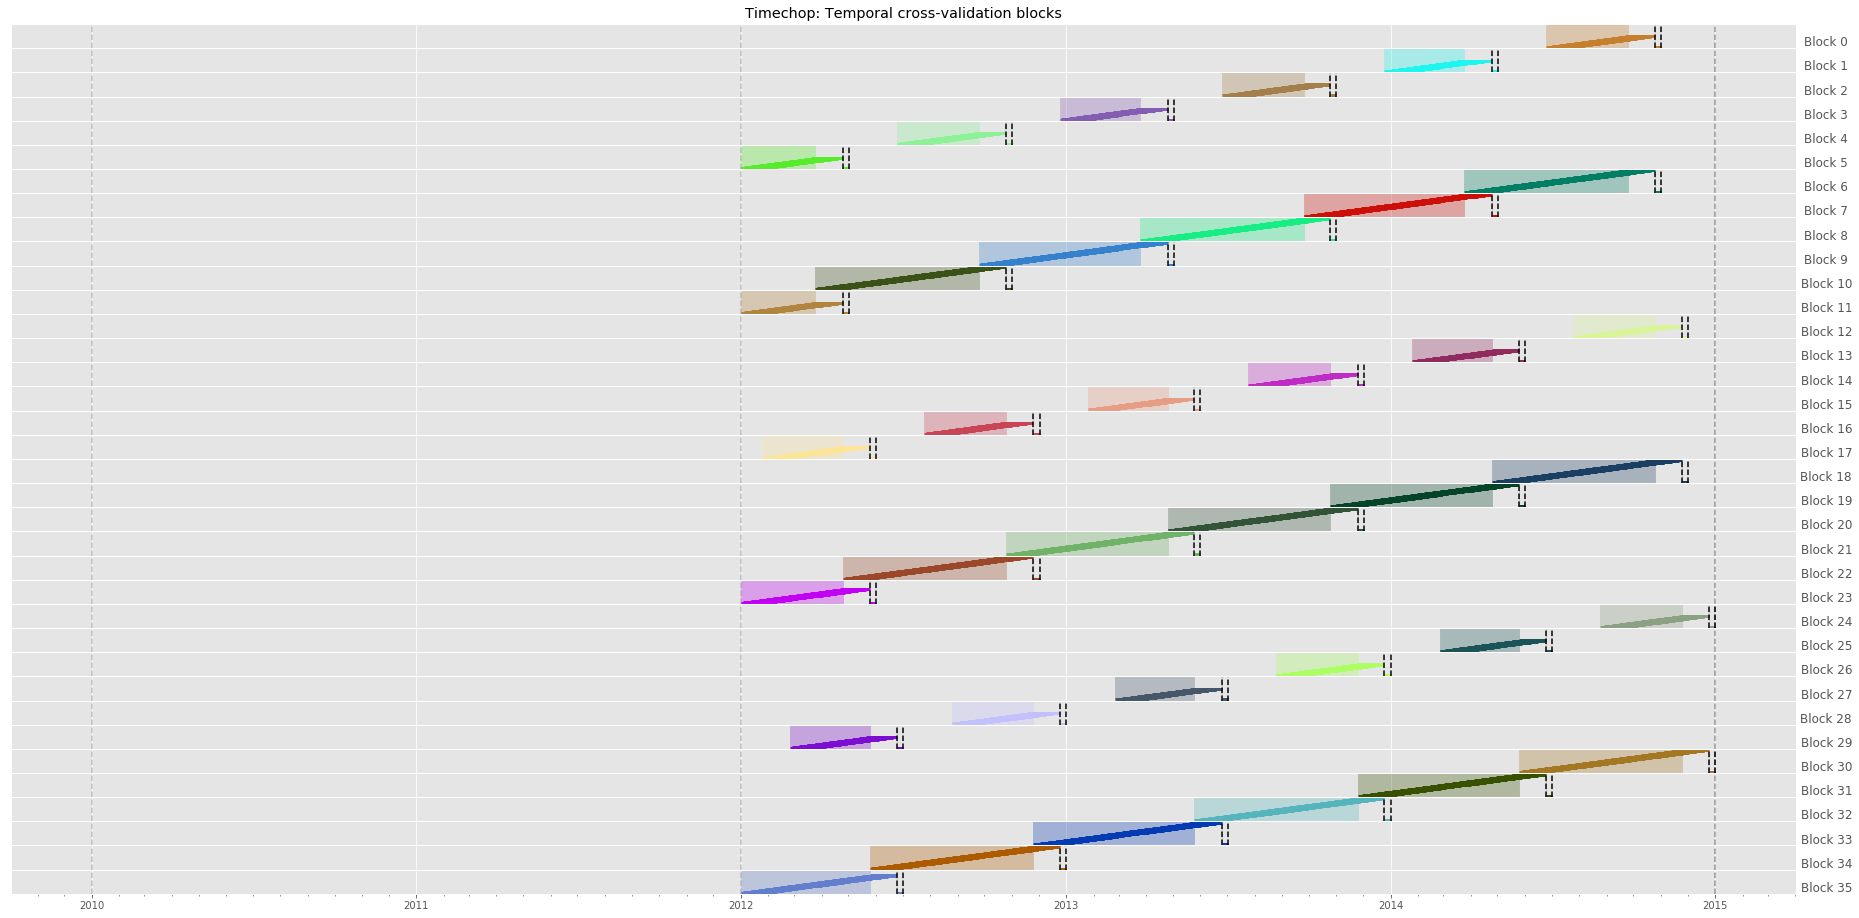
You can produce the time graphs detailed in the Dirty Duck deep dive using the Triage CLI or through calling Python code directly. The graphs use matplotlib, so you'll need a matplotlib backend to use. Refer to the matplotlib docs for more details.
Python Code#
Plotting is supported through the visualize_chops function, which takes a fully configured Timechop object. You may store the configuration for this object in a YAML file if you wish and load from a file, but in this example we directly set the parameters as arguments to the Timechop object. This would enable faster iteration of time config in a notebook setting.
from triage.component.timechop.plotting import visualize_chops
from triage.component.timechop import Timechop

chopper = Timechop(
    feature_start_time='2010-01-01'
    feature_end_time='2015-01-01'   # latest date included in features
    label_start_time='2012-01-01' # earliest date for which labels are avialable
    label_end_time='2015-01-01' # day AFTER last label date (all dates in any model are < this date)
    model_update_frequency='6month' # how frequently to retrain models
    training_as_of_date_frequencies='1day' # time between as of dates for same entity in train matrix
    test_as_of_date_frequencies='3month' # time between as of dates for same entity in test matrix
    max_training_histories=['6month', '3month'] # length of time included in a train matrix
    test_durations=['0day', '1month', '2month'] # length of time included in a test matrix (0 days will give a single prediction immediately after training end)
    training_label_timespans=['1month'] # time period across which outcomes are labeled in train matrices
    test_label_timespans=['7day'] # time period across which outcomes are labeled in test matrices
)

visualize_chops(chopper)
If you'd like to view the as_of_dates created in each of the training-validation sets, you can use the chop_time method on the chopper object. This may be useful if the dates in the visualization are hard to read. The code below walks through the output of chop_time.
train_val_sets = chopper.chop_time() # outputs a list

# How many distinct train-validation sets were created?
len(train_val_sets)

# Get the most recent train-val set (last element)
most_recent_set = train_val_sets[-1]

# Info about the training and test data for the most recent set
# including earliest/latest as_of_dates, all the included as_of_dates
most_recent_set['train_matrix']
most_recent_set['test_matrices']
Triage CLI#
The Triage CLI exposes the showtimechops command which just takes a YAML file as input. This YAML file is expected to have a temporal_config section with Timechop parameters. You can use a full experiment config, or just create a YAML file with only temporal config parameters; the temporal config just has to be present. Here, we use the example_experiment_config.yaml from the Triage repository root as an example.
triage experiment example_experiment_config.yaml --show-timechops
Result#
Using either method, you should see output similar to this: